




Diagnosis · Read the occupancy

An occupancy that's slipping, with no single cause

Occupancy doesn't lie. It says what the stay mix, the channel and the calendar no longer tell on their own.
average occupancy for independent hotels in 2026, down 0.6 points year on year.
The setup

_The dip isn't temporary anymore. It's become the new baseline — and that baseline is what has to be read, week after week, mix by mix, before touching a single rate or distribution lever._

Symptoms

You might recognise these signs.

  • Overall occupancy holds (62-65%) but average length of stay has slid from 2.4 to 1.8 nights in a few months — fragmentation is setting in.
  • The loisirs booking window has stretched to 35-40 days, and every weekly pricing call sits on a calendar you no longer see at 15 days out.
  • Sunday and Monday hold thanks to corporate, but Wednesday-Thursday is collapsing with no obvious reason — the dip isn't uniform across the week.
  • OTA cancellations climb toward 20-22%, twice the direct rate, and you discover the no-show on the morning of check-in.
  • Seven-plus night stays you can't quite attribute are showing up — long-stay, remote workers, on-site career transitions.
Method

Step by step.

  1. Read occupancy by day of week, not as an average.

    A monthly average of 63% says nothing. The same average can hide 82% on the weekend and 41% mid-week, or the opposite depending on your guest mix. Pull twelve trailing months and draw seven curves — one per day of week — compared to N-1 on equivalent periods. The leak almost always sits on two specific days, and the lever (mid-week business, weekend leisure, long-stay) is not the same depending on where it lives.

    Adjust for school holidays and shifted bank holidays. A Wednesday during All Saints isn't a standard November Wednesday — without that filter, you're reading noise.

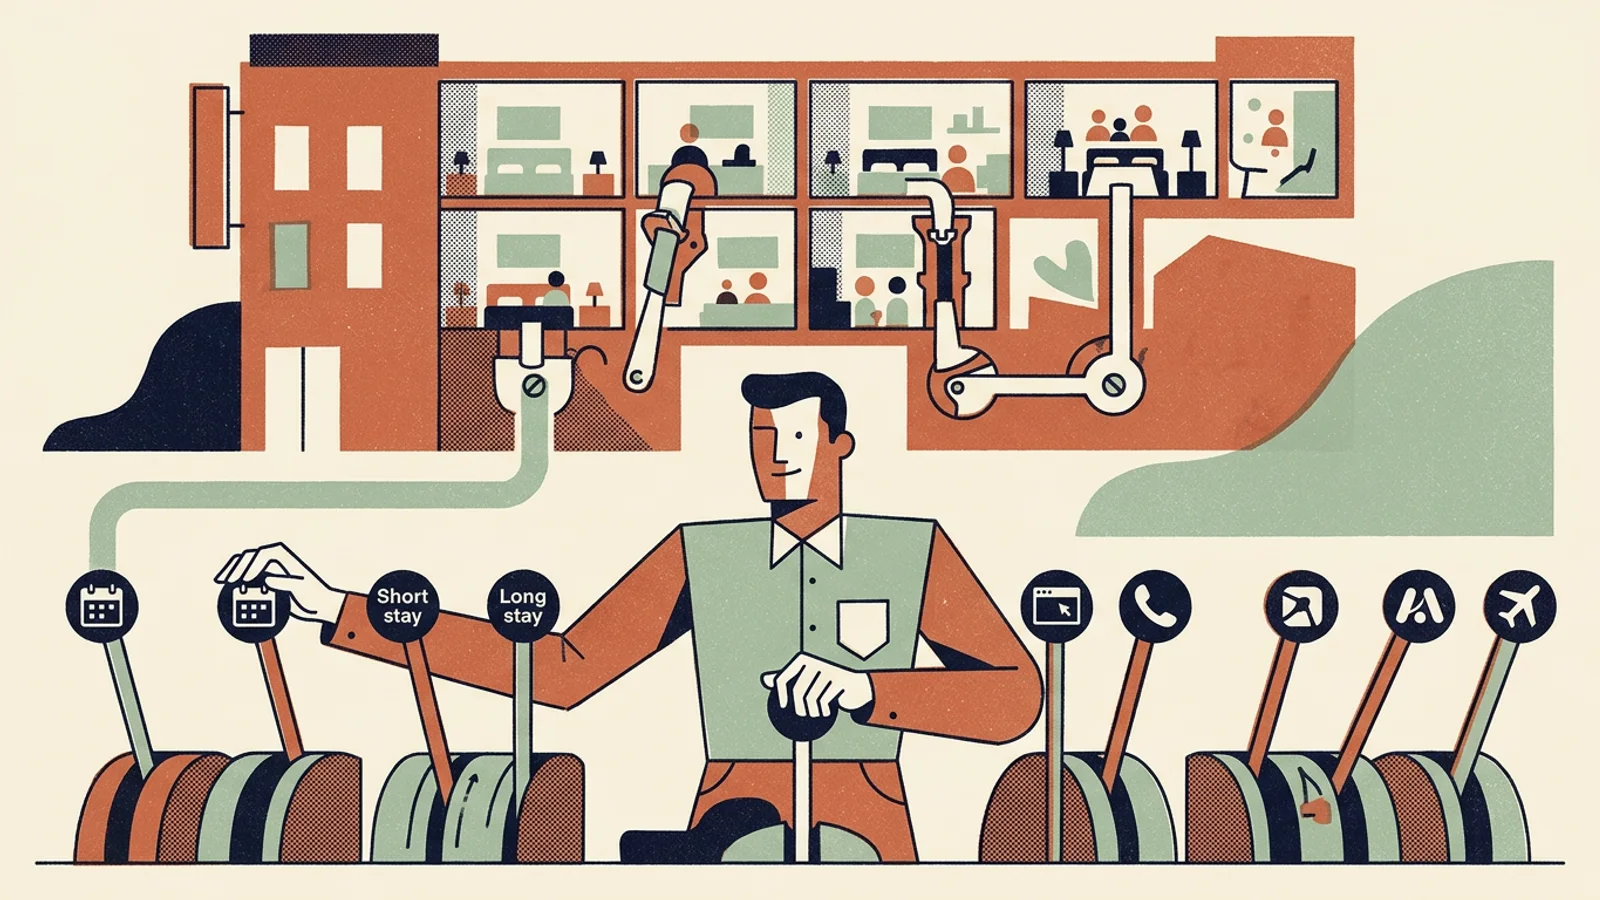
  2. Separate short stays from long stays.

    Two thirds of stays in independent hotels last 1 to 2 nights, but the 7-plus night segment grew 25% in one year. The two mixes don't sell, clean or cancel the same way. Pull arrivals by length of stay (1n / 2n / 3-6n / 7n+) over three months. If 1-night share is climbing while occupancy holds, you already have a cost signal — every room turns over more often and housekeeping absorbs the difference.

  3. Break the mix down by channel and segment.

    Global occupancy doesn't say who is filling the room. Pull OTA / direct / agency / corporate share by guest segment (solo leisure, couple, family, business, long-stay) over six months. A room sold at £110 via Booking does not produce the same net margin as a room sold at £95 direct (OTA commission 18-22% vs direct 4-5%). The same question applies if OTA dependence crosses a structural threshold — Measure OTA dependence deepens the channel read.

  4. Read the pickup, not just the final stock sold.

    Pickup is the speed at which room-nights come in day after day for a future date. Three useful reads: pickup at D-30, D-15, D-7. If pickup collapses at D-30 but catches up at D-7, your guests have simply shifted their booking — the window stretched, not the demand. If pickup collapses at D-30 and never catches up, the dip is real. An owner watching only the final stock sees the same curve — but cannot tell timing from volume.

    Every Monday morning, note pickup for the next four weekends. Three lines, ten minutes. It's sharper than any monthly report.

  5. Benchmark against your neighbourhood, not your best year.

    The right marker isn't your record season three years ago — it's what two or three comparable hotels are doing on the same catchment: same band, same room count, same guest typology. If everyone is dropping at the same time, the issue is macro and calls for other levers (segment mix, repositioning). If your comparable neighbours hold and you don't, the issue is local and identifiable — visibility, Google listing, review gap, photos, freshness of reviews.

Do / Don't

Do

  • Track occupancy by day of week over twelve trailing months — seven curves, not one.
  • Pull length-of-stay distribution (1n / 2n / 3-6n / 7n+) across three consecutive months.
  • Measure pickup every Monday at D-30, D-15, D-7 on the next four weekends.

Don't

  • Drop the BAR reflexively when occupancy slips — you'll never know if the lever was actually there.
  • Read monthly average occupancy as a signal — it's an aggregate; the diagnosis lives in the decomposition.
  • Compare to your best year. The independent market lost 0.6 points of occupancy in 2026 — your benchmark has aged.
A concrete case

Situation

An 18-room boutique hotel in Provence sees 61% occupancy over three months, down 4 points year on year. The owner's first reflex: drop the BAR 8% to lift volume on slow weeks.

Action

Before touching the rate, she breaks it down. Weekend occupancy holds at 78%, but Tuesday-Wednesday has gone from 52% to 38%. The share of 1-night stays climbed from 28% to 41% — a lot of single-night leisure between two stops. OTA share is stable at 68%. Mid-week pickup collapses at D-30 and never catches up at D-7. When she crosses with two comparable hotels in the area, they kept their mid-week — they built a dedicated weekday product (3-night package with local tasting, partnership with a producer).

Outcome

The diagnosis wasn't a pricing problem but a mix and calendar problem. A rate cut would have eaten 4 points of margin across the whole plan to chase volume on just two days. The real lever — building a weekday product that justifies 3 nights rather than 1 — was invisible in the average rate. Pricing didn't move; the focus shifted to creating a dedicated offer. To carry forward in Make them return.

Common pitfalls

Where it usually goes wrong.

  • Confusing occupancy rate with useful fill rate.

    A room sold for 1 night at £95, cleaned and re-sold 2 nights later at £95, gives the same occupancy as a room sold for 3 nights at £95. The first line eats three housekeeping passes, three check-ins, three laundry runs — margin isn't the same. Reading the rate without looking at length of stay is reading a number that hides a cost.

  • Reading a single month as a trend.

    One slow month after a strong one isn't a trend — it's mean reversion or a calendar effect (shifted bridges, school holidays, a cancelled local event). A trend is three consecutive months minimum, compared to N-1. Rushing to diagnose drives structural rate decisions on plain calendar noise.

  • Blaming the dip on generic OTA competition.

    Booking and Expedia did not magically decide to deprive you of guests. They redistribute existing demand — the real question is whether your OTA listing has slipped on a specific signal (rating, photos, freshness of reviews, Genius or Preferred Partner score). The diagnosis sits in the listing, not in the platform.

Takeaway

Your checklist.

  • Occupancy of the current month vs the same month N-1, broken out by day of week.
  • Average length of stay and the 1n / 2n / 3-6n / 7n+ split across three trailing months.
  • OTA / direct / agency / corporate share of room-nights, segment by guest segment.
  • Pickup at D-30, D-15, D-7 for the next four weekends and the next four weeks.
  • Cancellation rate by channel — an OTA / direct gap beyond 8 points is a signal.
  • Comparison with two or three comparable hotels in the catchment (band, size, typology).
What's next?

Diagnosis made. Now act on it.

You've just identified where it's breaking. Addressing it will take your time, your head, your energy. Meanwhile, your communication can't go dark — or turn into filler. Readytopost keeps it at a demanding level on the five social networks: posts written, images generated, calendar filled — calibrated on your hotel.

Start with ReadyToPost

Keep going on your own. The method for independent hotels lays out the principles that turn a diagnosis into durable action — across every lever, not just communication. Concrete markers to help you decide between two services, without imposed recipes or rigid calendars. At your pace, at your scale.

Continue to the method
hotel

Other guides for independent hotels

Weekly piloting for indie hotels

Four Monday indicators: piloting a boutique property

Four indicators read every Monday are enough to pilot an independent hotel. Not ten, not twenty: four — pickup J+7 vs J+30, ADR vs local market, direct/OTA channel mix, review sentiment last 7 days. Each triggers a clear decision at every reading. The rest is dashboard that reassures without changing anything. And it all fits in a shared spreadsheet — no €400/month revenue manager required.

Come back every year

The method for guests who come back every year

In hotels, the guest who returns a second time costs almost nothing to acquire — no OTA commission, no campaign, no Booking discount. And they're worth five times the margin of a new guest captured at 18% commission. Yet most independent hotels pilot acquisition and forget the cadence of return. A word, an attention, a well-placed email is enough — but it has to land at the right time.

Arrival weighs 80% of the stay

Arrival matters: the moment of truth in a small hotel

A guest decides their Booking score within the first twenty minutes: the pre-stay email they received, the smile at the front desk, the first five seconds in the room, the bathroom smell. The rest of the stay confirms or nuances — it no longer overturns. Everything that plays out before and at arrival weighs more than pillow quality or balcony view.

Pick a guest type to serve

Picking the guest type you serve: the pivot decision

With 20 keys, chasing the weekend couple and the Tuesday business traveller at once means serving both badly. Naming one or two guest moments — short weekend, mid-week business, family long-stay, 7+ night digital nomad — is the call that aligns the breakfast offer, the front-desk tone and the rate quoted direct.

Further reading

Related blog articles

  • case-studies

    A boutique hotel reclaims its margins

    No pro shoots. No agency. Just iPhone photos taken between two services, processed differently. Six months later, the numbers shift.

  • case-studies

    From idea to launched

    You have a new offer, a new season, or a new product. You need five networks to know. Here is the exact sequence, from idea to shipped posts.

  • ai-tools

    5 changes in Google search, explained

    The new Search isn't one product. It's five distinct launches stacked into one announcement, each with its own pricing and rollout schedule. Here is what Google actually shipped at I/O 2026, piece by piece.

  • social-media-strategy

    Google is ending its search bar.

    Google rebuilt the search bar as an AI agent. The click on the top organic result already dropped 58 percent. For an independent, the marketing minutes shift from SEO long-tail to social presence, the field where your name still gets remembered.

Questions

Frequently asked.

  • What occupancy rate is healthy for an independent hotel in 2026?

    The independent average sits around 60-65% over the year, down 0.6 points YoY. But the national figure hides huge gaps depending on catchment (urban, coastal, rural), seasonality and segment mix. More useful than the sector benchmark: your own rate by day of week over twelve trailing months. A Wednesday sliding from 55% to 40% in three months is actionable. A 63% global rate says nothing without that decomposition. The benchmark isn't the sector, it's you vs you.

  • How do I know if the dip is volume or stay mix?

    Cross two reads. If room-nights sold hold but average length of stay drops, the mix has fragmented — you're selling the same volume in shorter trips, which eats operational margin (housekeeping, check-ins, laundry). If room-nights sold drop and length of stay holds, it's a pure demand issue. If both drop together, look at the pickup: a D-30 collapse that doesn't catch up by D-7 says demand is genuinely receding.

  • Should I worry about a booking window that's stretching?

    Not in itself. The average leisure window has gone from 28 to 40 days in two years — that's the new norm. What matters is not confusing a wider window with falling demand. A room booked 45 days out is the same night as one booked 12 days out, but it stresses the pricing manager who sees stock sell earlier. Adjusting progressive closure thresholds and rate fences matters more than reacting to every pickup variation.

  • OTA cancellations are spiking — should I drop flexibility?

    OTA cancellation rates run around 21.8% in 2026 versus 10.6% direct — that's structural, not seasonal. Switching off flexibility can cut cancellation rates, but it also cuts conversion upstream — many guests don't book without the option to cancel. Before acting, measure cancellation rate by channel and segment, then the gap between cancellation date and arrival date (D-1 cancellation vs D-7 cancellation isn't the same problem — see [Measure OTA dependence](/en/resources/hotel/diagnosis/measure-ota-dependence)).

  • What's the difference between reading occupancy and reading RevPAR?

    Occupancy measures fill. RevPAR (revenue per available room) measures what that fill earns. You can have rising occupancy and falling RevPAR — if you're filling by breaking price. The opposite is also true: a 3-point drop in occupancy can pair with steady RevPAR if segment mix moves up. Reading occupancy is the entry door; RevPAR tells the rest of the story — see [Decode RevPAR](/en/resources/hotel/diagnosis/decode-revpar).